Notes on The Universal Tactics of Successful Trend Trading: Finding Opportunity in Uncertainty
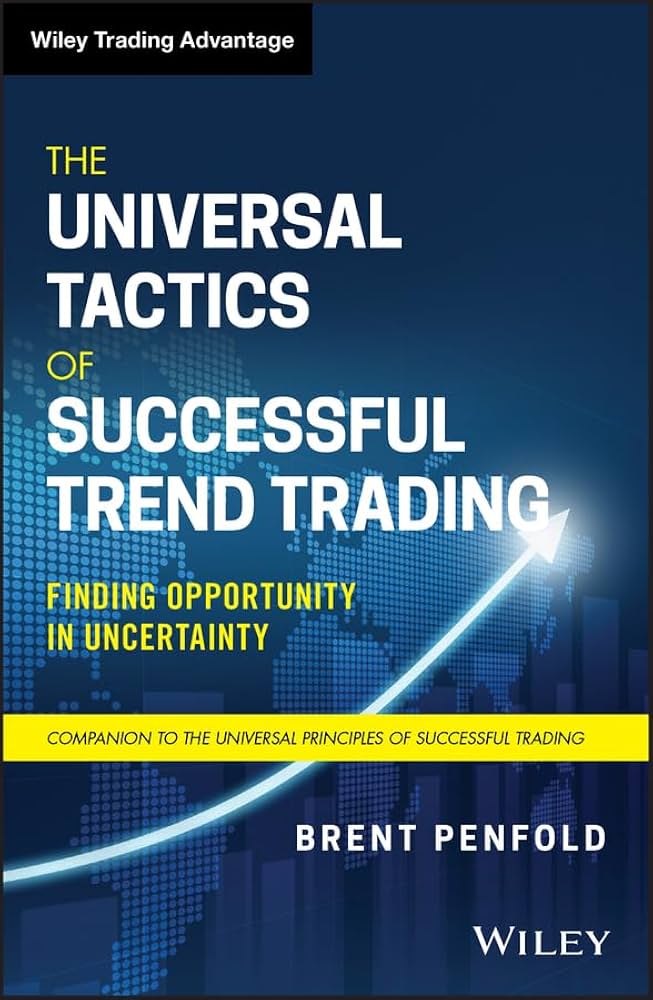
The Universal Tactics of Successful Trend Trading: Finding Opportunity in Uncertainty by Brent Penfold
Original notes here.
This book is about trend trading, in which 67% of trades are losers; the objective is to trade for positive expectancy rather than profit
There is nothing new under the sun. This book discusses old and simple trading principles, with no groundbreaking or mysterious concepts
The great way is simple; simplicity helps you avoid curve fitting. This book is written for traders, not speculators
The book applies to all markets, instruments, techniques, and time frames
Mechanical Is Essential
Only mechanical systems can be tested for expectancy and rate of ruin, thereby producing evidence
The only reason traders fail is that they violate the principle of a zero rate of ruin or are unaware of it
The two major factors determining the risk of ruin are money management and expectancy; see the previous book
Traders are living in the best of times because of the explosion of information, yet nine out of ten still fail, so they are also living in the worst of times; with so much distraction and choice, this is also an age of profound uncertainty
Key messages: technical analysis has little value; no one can predict the future; stop thinking about trading as such and focus on methods with positive expectancy; believing that there is a perfect strategy is extremely dangerous; thinking that you and your strategy are important is a stumbling block to success; admit that being a discretionary trader is difficult; beware of experts
The only difference between mechanical and discretionary traders is that the former have a complete trading plan and evidence, while the latter have neither and are completely ignorant of expectancy and rate of ruin; relying on their own ability to identify trends leaves them vulnerable to almost every cognitive bias. According to Barclay Hedge Fund research, from 1999 to 2019, the former grew total assets from $22 billion to $298 billion, while the latter grew from only $8 billion to $12 billion. The successful discretionary traders discussed in the author’s previous book are exceptions
Beware of experts who tell stories. Their opinions have nothing to do with expectancy and do not constitute actionable knowledge; they are all noise, and the more authoritative they seem, the more dangerous they are: economics, like religion, is built on belief, and choosing among schools of thought is even less scientific. Their motive is simply to win your trust and fleece you. Reifschneider and Tulip’s 2017 report, The Federal Reserve’s Approach, proves that economists are unable to make forecasts
https://www.federalreserve.gov/econresdata/feds/2017/files/2017020pap.pdf
Simplicity and Stability Are the Foundation
In a portfolio covering multiple markets, the robustness of the equity curve derived from out-of-sample data that was not available at the time of initial testing is crucial; the author uses R-squared tradability
If investing in stocks, choose the top three most liquid stocks from each industry
Four major indicators of failure: data mining based on a small number of specific markets or a particular region; overfitting (including too many rules, too many indicators, different trading variables, and different variables for different markets); using the latest trading concepts (with insufficient or even nonexistent out-of-sample test data); and the absence of an equity curve (meaning there is no strategy and it cannot be defined)
Validation software is extremely important. You can code your own programs or use third-party software such as Excel VBA, AmiBroker, channalize, multi-chart, trade navigator, tradeguider, trade station, and trading blox
Specific-market data mining must be avoided, and trading strategies must be clearly defined. To avoid overfitting, use simple principles: fewer rules, fewer indicators, fewer variables; the same variables across different markets; the same variables in the buy and sell framework; robustness rather than flexibility
Take seriously Art Collin’s famous quote in Market Beaters: after going through 17 engineers and spending four or five years testing, I found that the most basic four or five systems performed best
Variability kills indicators, which is why 90% of trading tools are so poor: in actual testing, making only five adjustments to three variables produced a maximum difference of 81% in historical performance, reduced expectancy by 68%, increased the rate of ruin from zero to 32%, and generated six distinctly different equity curves. This proves only that the strategy does not have a stable equity curve; the best variables keep changing and are impossible to pin down, but because of human nature and greed, the author guarantees that people will keep adjusting variables until they overfit
The only constant is that markets keep changing, yet they increasingly resemble one another; only the names and events change: the Savings and Loan crisis in 1980, the 1987 crash, the collapse of Japanese real estate in 1991, the Asian financial crises of 1994 and 1997, the collapse of Long-Term Capital Management (LTCM) in the United States in 1998, the dot-com bubble in 2000, the global financial crisis caused by the U.S. housing bubble in 2008, and the U.S. stock-market circuit breakers and coronavirus pandemic in 2020
Uncertainty is the norm, and no one can know the future—you must accept that; uncertainty causes delay, and delay is a trader’s greatest mistake; the only thing you can control is yourself
Following the Trend Is the Way to Go
Trend trading is divided into momentum and relative strength (RS); a trend points to the path of least resistance toward profit. Its three golden principles are follow the trend, cut losing positions (discard weakness), and keep rolling winning positions (buy strength); its five major advantages are durability, effectiveness, superiority, process simplification, and difficulty
It is durable because age has only made it stronger over nearly two hundred years. David Ricardo was the first to use it in 1838, when he already explicitly told friends to buy strength and discard weakness. The literature can be traced back to William Fowler in 1870, and the idea became a famous maxim after appearing in Livermore’s Reminiscences of a Stock Operator. Pat Hearnel may have been the first person to invent a mechanical trend strategy: enter with 100 shares, add on every 1% rise, and sell everything after a 1% fall. Dow Theory and Arthur Carlton’s approach conform to the principle of buying strength. The buy-strength, discard-weakness approach can also be found in Richard Wyckoff, George Seaman, and George Chestnutt. The classic Technical Analysis of Stock Trends is still a bestseller today. Harold Gartley, Nicholas Darvas, and Richard Donchian were all developers of mechanical trend-following strategies; the author regards Donchian’s 1960 Four-Week Rule as the most successful trend-trading strategy to date
It is effective because, first, the objections raised by critics do not hold up. Random walk theory (that prices move independently and are unrelated) and the efficient market hypothesis (that markets already reflect all information) both assume that prices move randomly. Alongside them are such important economic models as modern portfolio theory (MPT), the capital asset pricing model (CAPM), the Black-Scholes option-pricing model, and value at risk (VAR), all of which assume that prices move according to a normal distribution, forming a bell curve. Yet when the author uses a portfolio containing the 24 most liquid markets, the distributions of daily, weekly, monthly, quarterly, and monthly returns are all highly non-normal, taking the form of fat tails and a sharp/tall peak (leptokurtic distribution)—both extremes and the center are much more pronounced than in a bell curve. Fat tails reflect the effectiveness of trend-following strategies, while the thin peak reflects the effectiveness of mean-reversion strategies. Historical verification shows that the assumption of a normal distribution was already invalid even when random walk theory was first published; one can only speculate that it was adopted because it was useful and convenient
There are two explanations for why trends exist:
One is behavioral finance, which points out that the efficient market hypothesis assumes people are highly rational, while people actually have emotions and cognitive biases, preventing information from being reflected quickly and efficiently in prices. They often underreact because of preconceptions, stubbornly held views, selective attention to evidence, clinging to old habits, and loss aversion, while herd mentality and recency bias lead to overreaction
The other is that markets are path dependent, so history continues to exert a strong influence
Specific academic evidence also includes:
Kaminski & Greyserman’s Trend Trading & Managed Futures: over the nearly eight hundred years from 1223 to 2013, a trend-following portfolio generated an annualized return of 13.0% across 67 markets (going long or short according to whether price was above or below the rolling return of the previous 12 months)
Hurst, Ooi, Pedersen, A Century of Evidence on Trend-Following Investing: from 1880 to 2013, a portfolio covering 67 markets generated an annualized return of 14.5%
Academic analysis can still fall prey to overfitting and data-mining fallacies, so actual performance must also be examined
It is superior because there is a track record, comprehensively presented in Michael Covel’s Trend Following. Asset managers providing outstanding performance records include:
David Harding / Winton Capital
Bill Dunn / Dunn Capital Management
John Henry / John W Henry & Co
Ed Seykota
Keith Campbell / Campbell & Co
Jerry Parker / Chesapeake Capital Management
Selem Abraham / Abraham Trading Company
It simplifies the process because there is no need to choose markets, indicators, techniques, schools, or companies, nor to make any predictions or answer questions about the macroeconomic or political outlook; you need only adhere to the three principles of following the trend, buying strength, and discarding weakness
It is difficult because 67% of trades are losers, and the fat-tail, thin-peak curve takes a long time to form. You must endure losses before you can enjoy the fat tail, which puts retail traders off—but that is precisely the great advantage
Actual Testing
To test the three golden principles, the author used eight markets, flipped a coin to decide whether to buy or sell, and exited at the next day’s open. Without fees, the result was a small profit; after imposing a 1% stop-loss, the maximum loss fell sharply while profit per trade declined only slightly, resulting in a small reduction in net profit; retaining profitable positions until the previous week’s low (or the high in the opposite direction) produced several times the net profit without trading costs, and still a small profit after costs; using 24 markets instead (P24) produced higher net profit without fees because of the greater trading volume, but was not profitable with fees; adding the 200-day moving average to define the trend turned it into a $568K profit, 15,871 trades, and $36 average profit per trade after fees
The following tests basically all use P24, covering 40 years of historical data, with $51 per trade, using both long and short directions (for short trades, every operating condition is the opposite of the long side; only long-side operating conditions are described below, and opposite exit conditions are not stated), entering at the next day’s open once the conditions are met. The Pat Hearne’s 1% rule lost money because of changes over time; all the other trend strategies were profitable. The better ones were
(strategy, cumulative net profit, number of trades, average net profit, entry condition, exit condition)
50/200-Day Moving Average Crossover, $1.72M, 1,235, $1,389, SMA50>SMA200
Four-Week, $1.60M, 6,120, $262, break four-week high to buy, break four-week low to stop
Bollinger (80, 2), $1.56M, 2,954, $528, break upper band to buy, break middle band to stop
52-Week, $1.44M, 475, $3,038, four-week version extended to 52 weeks
Turtle, $1.41M, 5,212, $272, break four-week high to buy, break two-week low to stop, while using the previous trade’s loss as a trading signal
ATR, $1.19M, 3,544, $337, break upper band to buy, break middle band to stop
Dow Theory, $1.09M, 17,927, $61, Dow trend changes that day
Three-Six-Week Crossover, $1.08M, 3,387, $319, buy on Monday when SMA3 (W) of the average HL > H-SMA6 (W), stop when < L-SMA6 (W)
Monthly Close, $1.00M, 4,993, $201, monthly close above the previous month’s
Quarterly Close, $611K, 1,670, $366, quarterly close above the previous quarter
The above are ranked by cumulative profit; strategies with outstanding average profits but lower cumulative profits do not appear on the list
The P24 portfolio comprises indices, grains, oil, metals, meats, currencies, interest rates, etc. Their symbols are:
SB, ZW, CO, SO, HO, LC, GF, BP, SV, KC, CT, ZB, GC, HG, JY, LH, SP, TY, CL, FV, NG, ND, EC, YM
Risk
Apart from profitability, the scale of the underlying risk is also important. Sharpe (annual excess return / its standard deviation) is widely used, but as noted above, standard deviation ignores the reality that price distributions are not normal, and even treats positive risk associated with profits as equal to risk associated with losses, thereby penalizing superior returns (hence the Sortino ratio, which considers only the standard deviation of negative returns). It also ignores drawdowns from a high, so radically different equity curves can have the same standard deviation, making it unable to quantify what traders actually care about
By comparison, the Ulcer Index (UI), invented by Peter Martin in 1987 and published in the Fidelity Fund Investor Guide, is far better. It can be used for indices, stocks, and strategy equity curves; 0% is perfect, while 100% means permanent ruin
The algorithm is the square root of the sum of the squares of the drawdown percentages from the historical high for each annual period end; monthly and weekly versions can also be used
Its advantages are that it focuses on the real problems traders care about and concentrates on measuring losses. It is not limited to the maximum drawdown, so it can identify strategies that, overall, have fewer drawdowns
The UPI, Ulcer Performance Index = annual excess return / UI
In comparative testing, Sharpe could not highlight the superiority of the four-week strategy, but it was reflected in the Sortino ratio and UPI, especially the latter
Among the various strategies tested in the previous chapter, the top six by UPI were: Turtle 2.2, Bollinger 1.7, Five-Two Hundred-Day Moving Average 1.5, Four-Week 1.4, Dow Theory 1.4, 52-Week 1.3
However, UPI is not absolute. Not all strategies are created equal, and the market structures they seek to capture are partly different, making them difficult to compare directly in every respect
> 2 is quite good; <.5 is too low, but the key is to compare like with like
Comprehensive Analysis
It includes the following five aspects
Survivability: rate of ruin
Return: net profit, maximum drawdown, return-risk ratio, UPI
Risk: average loss
Capital management efficiency: net profit after capital management adjustment, annual compound return
Trading difficulty: number of days in the maximum drawdown, maximum consecutive losses, R² smoothness of the equity curve (~90% is desirable)
Some strategies that appear good may be hiding distant stop-losses. Examining their efficiency under capital management can expose the problem
Zero rate of ruin is king; annual compound return is queen
The final piece of the puzzle is equity-curve stability analysis. Taking the Bollinger strategy as an example, with adjustments of 0.1, each of the two variables is given five variations: channel length 64/72/80/88/96, standard deviation .8/.9/1/1.1/1.2, producing 25 equity curves. The results show little variation in either the curves or expectancy, and the rate of ruin is zero in every case, indicating that it passes
Using the above framework, the original strategies are re-examined, eliminating those with too many rules or variables, insufficient out-of-sample data, or a non-zero rate of ruin
Then remove those with a return-risk ratio ≤2 or UPI≤.5. The four eliminated strategies were disappointing in CAGR, maximum drawdown duration, and R²
The Five-Two Hundred-Day Moving Average was eliminated because its founding year could not be established, so it was considered to have no out-of-sample data
Strategies with too many rules and variables were temporarily retained because they had out-of-sample data
The remaining top ten are ranked by CAGR: Monthly Close, Bollinger, Turtle, Dow Theory, Four-Week
The 52-Week strategy fell to ninth because its stop-loss was too large, leaving its CAGR at only 10%. It is a pity because its R² reached 98% and its maximum drawdown duration was the second shortest
Although Monthly Close ranked first in return, its return-risk ratio was only 3, its UPI only 0.8, its drawdown duration was the second longest, and its R² was only 83%, indicating a volatile equity curve
Although Bollinger was excellent, its variables were assumptions made by the author for the simulation and had never been formally published, so the lack of official out-of-sample data was a concern
The author therefore turned his attention to the Turtle strategy, which ranked third, and conducted an equity-curve stability analysis: entry variables 2/3/4/5/6, exit variables 1/2/3/4, producing 20 curves. The variation in the curves and expectancy was substantial, but none had a rate of ruin, so it was selected by the author
It is recommended that readers find a trading textbook from 2000 and test and analyze its strategies according to the above procedure, ensuring at least 20 years of out-of-sample data
Data splitting is one method of out-of-sample testing, but the author sees no need for it when the strategy predates 1980
Strategy Adjustment
After comparing different strategies, it is advisable to adjust individual methods for deeper study. Take Dow Theory, with its 120-year history, as an example. Although the daily Dow strategy is not ideal, it can be re-examined using weekly and monthly frameworks
The results show that the weekly version is superior to the daily version in almost every respect, with lower drawdowns and higher profits, while the monthly version is even more stable, though its CAGR is lower than the other two
However, in terms of average risk, the monthly version is higher than the weekly, and the weekly higher than the daily. Its maximum drawdown was still too large, so the following adjustments aim to reduce drawdown
The author then retested it by adding the same loss-filtering mechanism as the Turtle strategy, using the previous trade’s loss as the trading signal
The results showed that most indicators of the daily strategy improved substantially; the weekly strategy became more stable at the expense of return; the monthly strategy generally deteriorated, but the maximum drawdown of all three was indeed reduced
Next, following the principle of selling weakness, the strategy was adjusted again: an initial stop-loss was introduced, exiting when the low of the daily setup candle or entry candle was broken, whichever was farther away. This applies to the daily, weekly, and monthly strategies
The result was lower drawdown for all three, with the daily and weekly strategies reducing risk and improving return, while the monthly strategy deteriorated further
The author then tested using weekly and monthly signals as entry conditions and daily signals as exit conditions, but the results were not ideal
Finally, the author points out that the weekly Dow strategy incorporating both loss filtering and an initial stop-loss reduces risk and drawdown compared with the Turtle strategy while increasing returns, with a CAGR of 29%
The current performance of the strategy, called MWDT, can be obtained by emailing the author through the following website, using the subject line “MWDT’s current performance”
indextrader.com.au
This strategy is applied to P2, P4, P8, and P16. It can be seen that the larger the market universe, the smoother the equity curve; all four curves rise and perform well
The author encourages readers to follow the trend and trade for the long term
Finished reading on Jan 12, 2022
Penfold examines how a trading method can survive uncertainty, avoid overfitting, and demonstrate robust expectancy. The First Principles of Perennial Profit in Investing asks the deeper question: what causal condition makes an investment method capable of sustaining profit beyond what historical testing alone can establish?