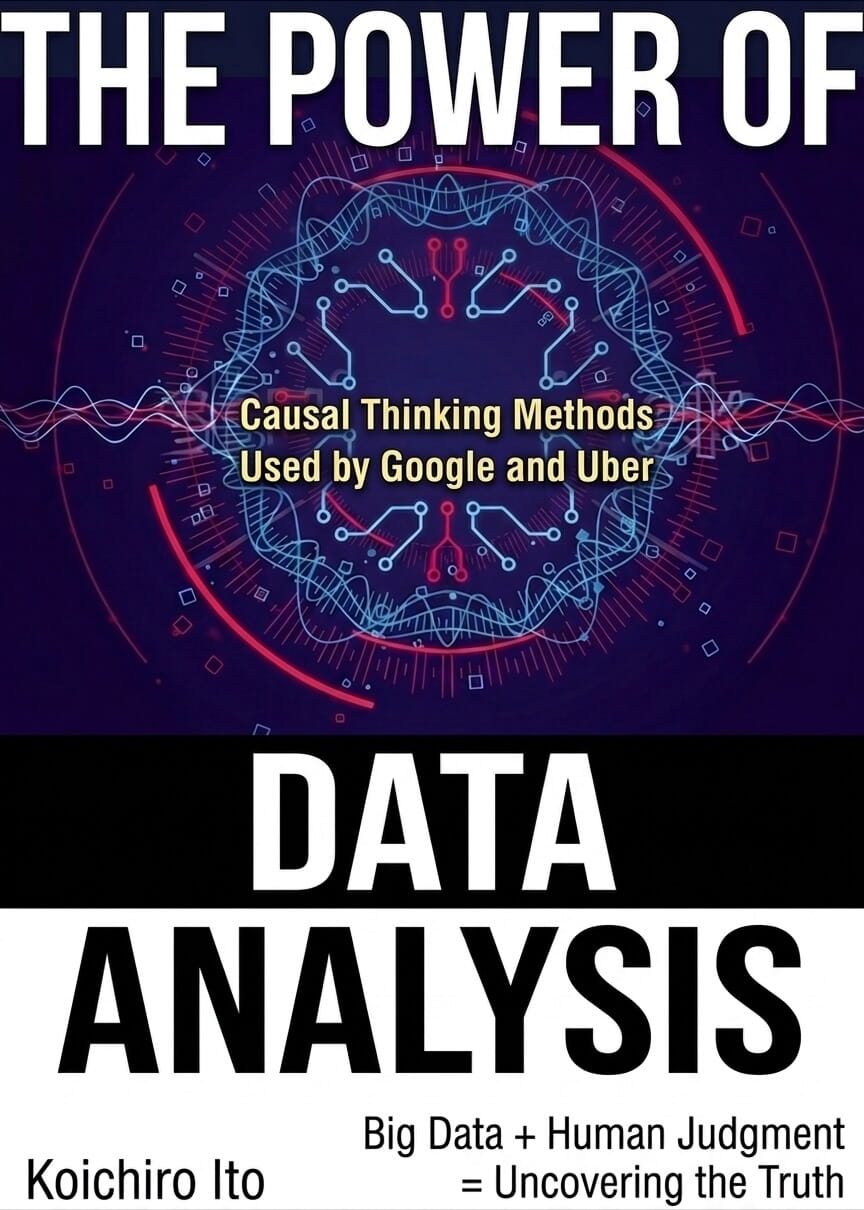
Notes on Koichiro Ito's The Power of Data Analysis: How to Approach Causality
Original notes here.
Read until the end to get a bonus. Enjoy reading.
Information analysis is now extremely important across all walks of life, whether in private companies, government, or education.
Governments need to know whether subsidies are effective, while schools need to know whether teaching materials are effective.
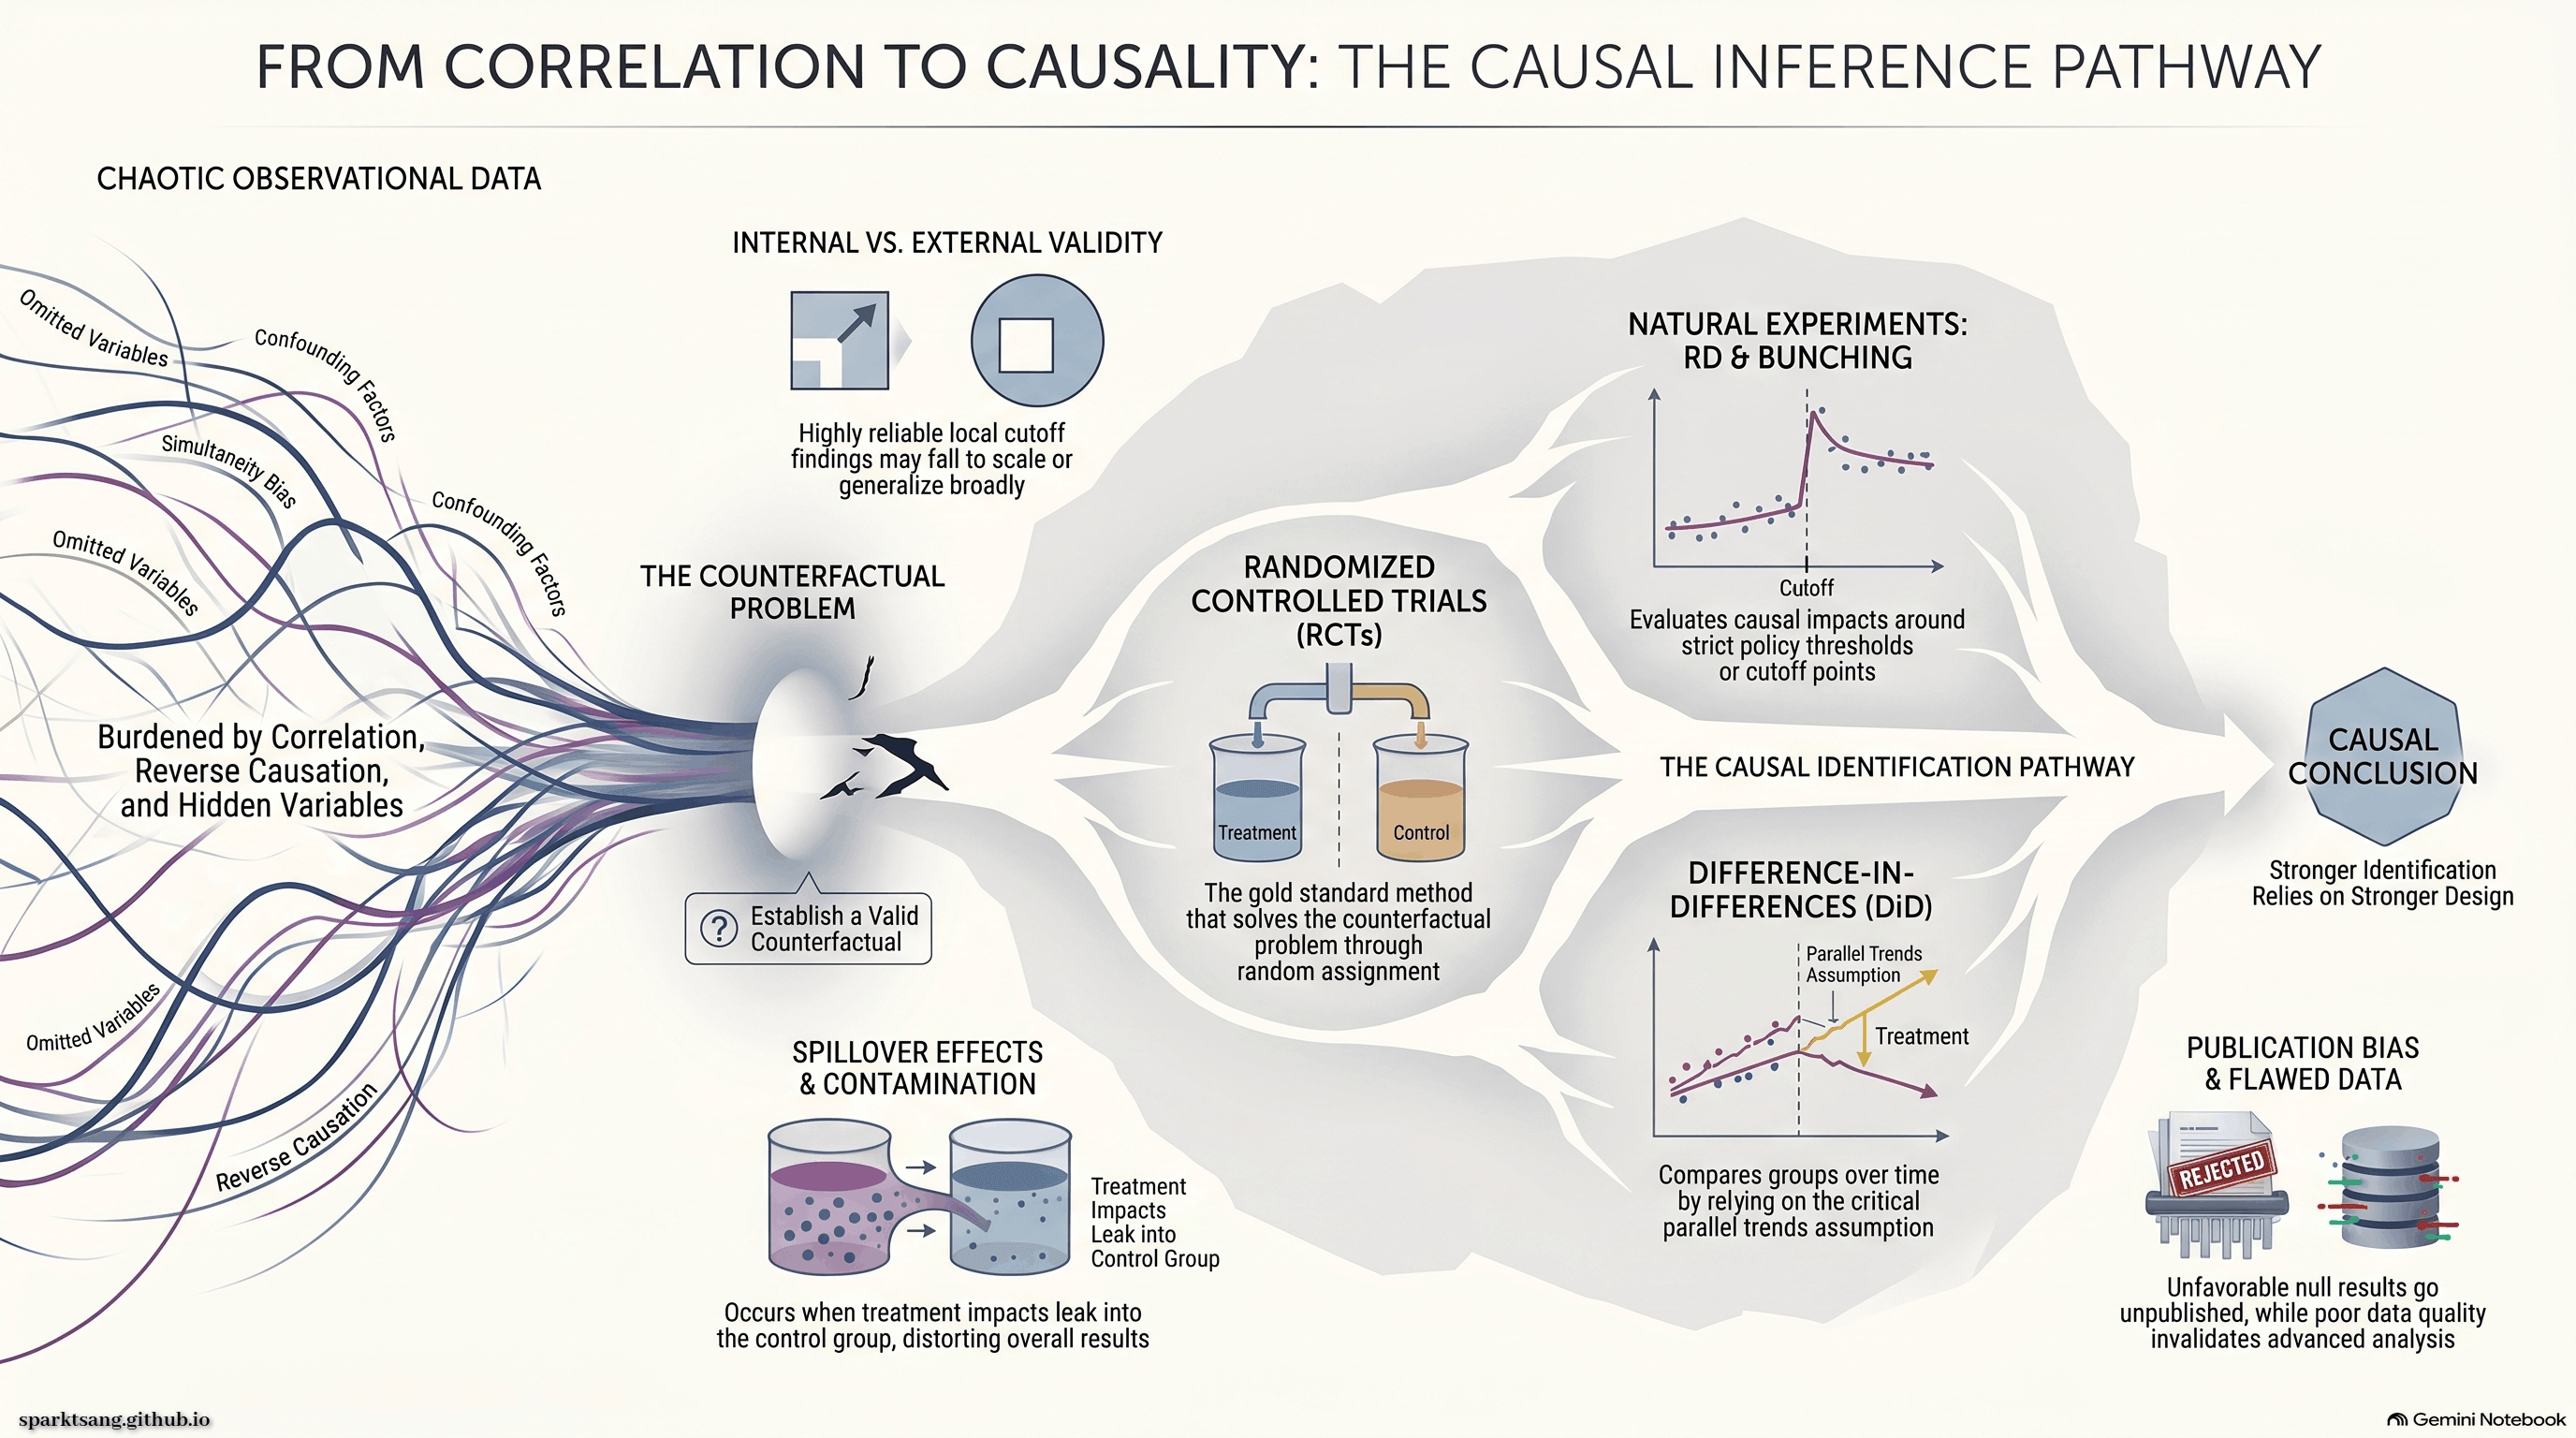
Chapter 2 introduces the best method for problems where it is difficult to derive causal relationships, one that can resolve the problem with 100% certainty. In academic fields such as medicine and economics, this method is called an RCT, or Randomized Controlled Trial (randomized controlled experiment); in business, it is called A/B testing. It has long been used in medicine, but has only recently been adopted in economics and business.
If the above methods cannot be used, another common method is the natural experiment.
Correlation does not equal causation. It may be reverse causation, or another factor V may affect both sides.
Yet society and news reports often mistake correlation for causation.
A 1999 University of Pennsylvania study found a correlation between children sleeping with the lights on and myopia, and it was widely reported as showing that sleeping with the lights on causes myopia.
But a later study by Ohio University found that the real reason was that most parents with myopia slept with the lights on, while their children were also more likely to inherit myopia.
Other factors are difficult to exhaust through research. Even if we come up with more and more V factors, there are still infinitely many possible factors that could exert an influence, and many factors cannot be observed in the data.
This kind of bias cannot be solved even by big data (increasing the amount of data).
Donald Rubin of Harvard University proposed the potential outcome approach in 1974.
It measures causality through the effect of an intervention.
Take the correlation between a rise in electricity prices and a fall in electricity consumption: the treatment effect is Y1, the amount of electricity actually consumed after electricity prices rise, minus Y0, the amount that would have been consumed if electricity prices had not risen.
The term treatment effect originally came from medicine, where it was used to study treatment efficacy.
But it is still difficult to derive causal relationships, because the data for the “if” case—the counterfactual potential outcome—never actually occurred. This is known as the fundamental problem of causal inference (Holand, 1986).
The solution is to establish a treatment group and a control group. The problem is how to divide them. If the groups are chosen voluntarily, people who are willing to experience a rise in electricity prices may already have a particularly strong willingness to conserve electricity.
The solution is random assignment. This method is called a randomized controlled trial, much like dividing people according to whether the outcome of a dice roll is odd or even. With a sufficiently large sample, the two groups will be homogeneous.
A simple website experiment had an enormous impact: Dan Siroker set up A/B testing (that is, a randomized controlled trial) on Obama’s campaign website and found that the family photo with a Learn More button produced an email sign-up rate 3.34% higher than the website design with the Sign Up button that the campaign team had chosen after discussion, raising an additional $60 million for Obama.
An electricity-price adjustment experiment that the author participated in analyzing demonstrated that raising electricity charges was more effective and more lasting than moral persuasion (sending requests to conserve electricity).
Random assignment can be divided into simple randomization and cluster randomization.
The former simply assigns groups according to random values, no different from rolling dice.
The latter first divides subjects with the same characteristics into clusters. For example, with twenty people, ten men and ten women, they are first divided into two groups of five men and five women each, and then randomized within each group.
See Duflo, Glennerster and Kremer (2007) for details.
This method does not analyze existing data; it creates data in order to obtain an answer, so it is not cheap.
If the above methods are impossible, one can instead make good use of situations that are almost as if an experiment had been conducted.
This book uses the term natural experiment for a method called regression discontinuity design.
In Japan, once elderly people pass their 70th birthday, their out-of-pocket cost of medical expenses falls from 30% to 10%.
The data show a jump in the number of patients seeking medical care immediately before and after age 70.
The assumption that this is caused by the reduction in out-of-pocket expenses cannot actually be proved completely. But for it not to be true, there would need to be other discontinuous factors—for example, pension payments would have to increase substantially from the 70th birthday onward. Yet no such problematic factor exists. Nor is there evidence that subjects could simply lie about their age and indirectly manipulate the data.
The drawback of the method is that it can only establish causal relationships for people close to the age-70 cutoff.
In 2008, electricity prices in southern Orange County, California, doubled because the area was served by different electricity companies. This was also a classic natural experiment.
Another natural-experiment method is called bunching analysis, proposed by Emmanuel Saez in his doctoral dissertation (1999, 2010).
Fuel-economy regulations change in steps, and the distribution of automobile weights bunches tightly to the right of the cutoff.
The hypothesis for establishing causality is that if fuel-economy regulations did not change in steps, the distribution of automobile weights should be smooth and continuous, without bunching.
The hypothesis cannot be proved completely, but it can be shown to be very likely true because the distribution is smooth away from the cutoff; the cutoff applies only to the fuel-economy policy; and when the fuel-economy policy changes, the location of the bunching also shifts neatly.
For a more detailed and accurate explanation, see Ito and Salle (forthcoming) or Kleven (2016).
The results show that the average weight of one-tenth of the cars on the market increased by 110 kilograms, further reducing fuel efficiency.
Since weight is distorted by regulation rather than determined by the market, this inefficiency creates a deadweight loss. Furthermore, heavier cars reduce road safety for others.
Its advantages and disadvantages are similar to those of RD, and it is only effective for data close to the cutoff.
Income-tax brackets also affect bunching in taxpayers’ income, but not as markedly as expected (Cherry, Friedman, Olsen, and Pistaferri, 2011).
Another method using panel data is Difference-in-Differences (DiD), which relies on the “parallel trends” assumption: if the intervention had not occurred, the average outcomes of the treatment and control groups would have continued to move in parallel.
The two groups must already have been moving in parallel before the intervention, and no other factor can affect the treatment group.
The advantage of this method is that it can analyze not only subjects near a cutoff, but even if the two groups originally differed before the intervention began, that does not matter as long as the parallel-trends assumption holds, so it can be used in any situation.
The weakness is that the assumption is very easy to violate, and data from multiple periods for both groups are required.
In 2008, the U.S. government introduced a subsidy policy for trading in old cars for new ones. The study defined areas more heavily affected by the policy as the treatment group, and areas barely affected as the control group.
The results found a short-term buying surge among those affected, but no stimulation of aggregate demand (Mian and Sufi, 2012).
Technology companies routinely use RCTs to analyze business strategies. Google used an RCT to select, from 41 shades of blue, the blue with the highest click-through rate. The U.S. government also promoted evidence-based policymaking internally and formally enacted legislation for it under the Obama administration.
The author points out that the key to success lies in working with information-analysis experts and making data widely available.
Uber successfully used an RCT to derive an accurate demand curve, which helped with business policy-making.
The University of Chicago Crime Lab used an RCT to demonstrate that, compared with harsher punishment, providing high school students with the “Becoming A Man” (BAM) program was more effective at reducing crime, and, even more unexpectedly, increased the high school graduation rate by 15% (Heller et al. 2015).
If the data themselves are problematic, even the most outstanding analysis cannot compensate for that. One must also pay attention to the scope of the analytical method. RD design can only target subjects near the cutoff, while bunching analysis can only target subjects where bunching occurs. This is known as the problem of external validity, while the reliability of the analytical results is called internal validity.
Research results sometimes suffer from publication bias. If one finds a result showing absolutely no causal relationship, that should also be a useful scientific finding, yet it is considered difficult to publish and is left to languish.
Spillover effects occur when the intervention also affects the control group, which may also affect the conclusion. For example, suppose we investigate the benefits of allowing students to borrow computers for free. Students who receive computers (the treatment group) may lend them to others (the control group) to use. One possible method is the kind used in the study by Duflo and Saez, 2003: establish treatment colleges and control colleges, and quantify the spillover effect.
Whether the results of a small-scale experiment can be reproduced through large-scale implementation requires careful assessment, because other factors may emerge when it is implemented on a large scale.
This book omits analytical methods requiring more advanced statistical knowledge, such as instrumental variables, matching methods, synthetic control groups, discrete choice methods, structural estimation, and so on.
This book belongs to the field of econometrics and is a highly introductory book. Those interested can first read an introductory book and then move on to an intermediate-level one, with English-language books preferable for the latter. Recommended from easy to advanced:
Wooldridge, introductory econometrics, 2015
Angrist and Pischke, mostly harmless econometrics, 2008
Cameron, microeconometrics, 2005
Finished reading on Dec 19, 2019
Thank you for reading until the end. This is a bonus infographic just for you.